Debugger
The Memril debugger provides advanced breakpoint functionality for monitoring memory access patterns and execution flow in target processes. It operates through a custom DLL injection system that enables real-time debugging capabilities without requiring external debugger attachment.
Features
Breakpoint Types
- Execute Breakpoints: Trigger when code at a specific address is executed
- Write Breakpoints: Trigger when memory at a specific address is written to
- Access Breakpoints: Trigger when memory at a specific address is read from or written to
Monitoring Capabilities
- Multi-Address Tracking: Monitor multiple memory locations simultaneously
- Access Pattern Analysis: Track which code addresses access monitored memory locations
- Hit Count Statistics: View how many times each address has been accessed
- Register State Capture: Examine CPU register values at the moment of breakpoint trigger
- Call Stack Unwinding: View the complete call stack when breakpoints are hit
Interactive Features
- Context Menus: Right-click addresses to copy, bookmark, or browse memory locations
- Memory Navigation: Jump directly to monitored addresses in the hex editor
- Bookmark Integration: Add frequently accessed addresses to bookmarks for quick reference
How It Works
The debugger operates through a sophisticated DLL injection mechanism that patches the target process's Import Address Table (IAT):
- Code Cave Detection: Locates unused executable memory regions within target modules
- Shellcode Injection: Injects custom assembly code that loads the debugger DLL
- IAT Hooking: Temporarily replaces import table entries to execute the injection payload
- Shared Memory Communication: Establishes a shared memory region for real-time communication between the debugger and injected DLL
Technical Implementation
- Uses hardware debug registers for efficient breakpoint implementation
- Employs structured exception handling to capture breakpoint events
- Maintains minimal performance overhead through optimized polling mechanisms
- Automatically resolves call stack addresses to module names when possible
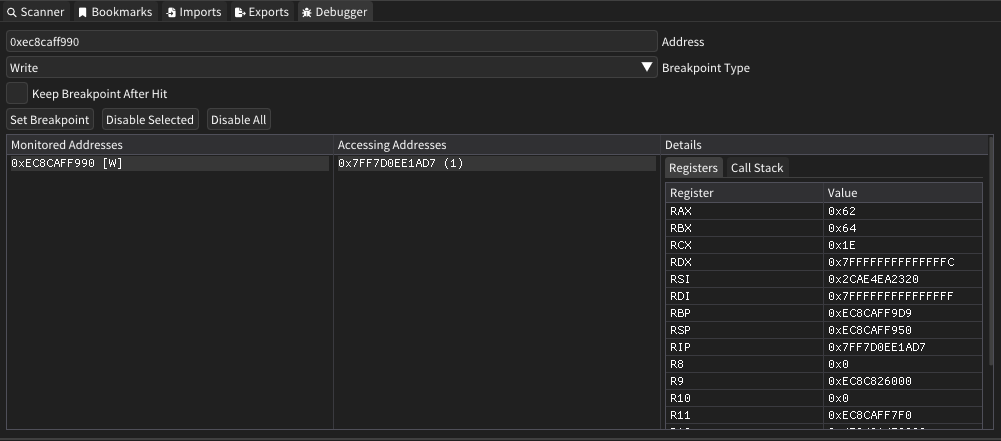
User Interface
The debugger window consists of three main sections:
Monitored Addresses
Displays all currently active breakpoints with their types:
[X]- Execute breakpoint[W]- Write breakpoint[RW]- Access (read/write) breakpoint
Accessing Addresses
Shows which code locations have triggered the selected breakpoint, along with hit counts in parentheses.
Details Panel
Provides comprehensive information about breakpoint hits:
- Registers Tab: Complete CPU register state at breakpoint trigger
- Call Stack Tab: Full call stack with resolved module names where available
Injection Functionality
Before using the debugger, you must inject the debugger DLL (MemrilHelper.dll) into the target process. This is accomplished through the DLL injection system.
Please see the DLL Injection section for more information and requirements.