Details
The Details window provides comprehensive information about selected memory objects within the target process/driver. It serves as the primary source for examining detailed properties, attributes, and metadata of regions, pages, sections, and threads selected throughout the application.
Features
Multi-Object Support
The Details window dynamically adapts its display based on the type of selected object:
- Memory Regions: Complete region information including file mappings and PE structure
- Memory Pages: Individual page properties, permissions, and system flags
- PE Sections: Section-specific details for executable modules
- Threads: Thread state, timing information, and execution context
Organized Information Display
Information is presented in collapsible sections for easy navigation:
- Basic Information: Core properties like addresses, sizes, and types
- File Information: Mapped file details and ownership data
- Memory Statistics: Usage counts, commit charges, and mapping statistics
- PE Information: Portable Executable structure details for loaded modules
- Memory Attributes: Boolean flags indicating special memory characteristics
Visual Permission Indicators
Memory permissions are displayed with color-coded indicators:
- R (Read) - Green highlighting
- W (Write) - Yellow highlighting
- X (Execute) - Red highlighting
- C (Copy-on-Write) - Yellow highlighting (alternative to Write)
How It Works
The Details window operates through the shared state system, automatically updating whenever a new selection is made in other windows:
Selection Integration
- Automatically detects selection changes from Regions, Hex Editor, or other memory analysis windows
- Validates selection type and displays appropriate detail categories
- Maintains synchronized view with the currently selected memory object
Information Retrieval
- Accesses detailed metadata from the kernel driver interface
- Resolves file mappings and ownership information
- Calculates derived statistics like mapped/unmapped page counts
- Formats addresses, sizes, and timestamps for user-friendly display
Dynamic Content Rendering
- Adapts interface layout based on available information
- Hides irrelevant sections when data is not applicable
- Provides expandable/collapsible sections for organized viewing
User Interface
Not all details written below are currently implemented in Memril yet.
Thread Details
When a thread is selected, the window displays:
- Thread ID and Process ID for identification
- Start Address showing where thread execution began
- State and Wait Reason indicating current thread status
- Priority level and Context Switch count
- Timing Information including creation time and CPU usage
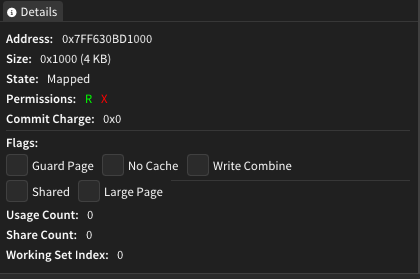
Page Details
For individual memory pages, information includes:
- Address and Size with both hex and human-readable formats
- State (committed, reserved, free) and Protection flags
- System Flags including Guard Page, No Cache, Write Combine status
- Usage Statistics showing reference and share counts
- Working Set Index for virtual memory management details
Section Details
PE sections display:
- Section Name and Virtual Address within the module
- Virtual Size vs Raw Size comparison
- Characteristics string describing section properties
- Page Statistics showing total, mapped, and unmapped page counts
Region Details
Memory regions provide the most comprehensive information:
- Address Mapping showing both virtual and mapped addresses
- Size Information with automatic KB conversion
- Type Classification (Image, Mapped, Private, etc.)
- File Mapping Details including full path and ownership
- Memory Statistics with commit charges and share counts
- PE Structure Information for executable modules
- Memory Attributes showing special characteristics
- Guard Page Analysis when applicable
Usage Tips
- The Details window automatically updates when you select different objects in other windows
- Use the collapsible headers to focus on specific information categories
- Color-coded permission indicators provide quick visual reference for memory access rights
- Size values are displayed in both hexadecimal and decimal formats for convenience
- File mapping information helps identify which disk files are loaded into memory regions
- PE information is only shown for executable modules and DLLs
- Memory statistics help understand memory usage patterns and sharing characteristics