Threads
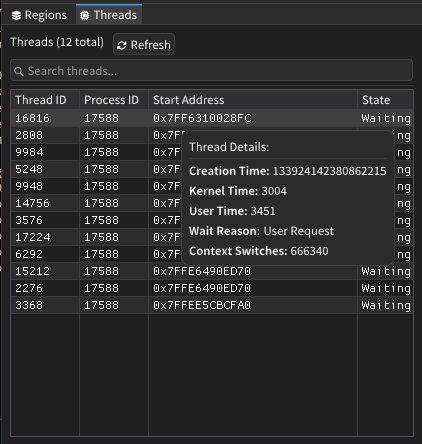
The Threads window provides comprehensive thread analysis capabilities for examining all threads within the selected process. It displays detailed thread information including execution state, timing data, and memory addresses, with interactive features for thread selection and analysis.
Features
Thread Information Display
- Thread Identification: Shows Thread ID and Process ID for each thread
- Start Address: Displays the memory address where thread execution begins
- State Information: Current thread state (Running, Waiting, Ready, etc.)
- Timing Data: Kernel time, user time, and creation timestamps
- Context Information: Wait reason and context switch counts
Search and Filtering
- Real-Time Search: Filter threads by Thread ID, Process ID, or start address
- Case-Insensitive: Search works with both uppercase and lowercase input
- Flexible Address Search: Find threads by address with or without "0x" prefix
- Instant Results: Search results update as you type
Thread Selection and Navigation
- Visual Selection: Selected threads are highlighted in gold color
- Memory Integration: Automatically selects threads when their start address is viewed
- Quick Navigation: Click any thread to jump to its start address in memory view
- Bookmark Creation: Add bookmarks at thread start addresses for later reference
How It Works
The Threads window retrieves thread information by traversing the kernel's thread list structures within the target process. It reads thread control blocks (ETHREAD/KTHREAD structures) from kernel memory to extract detailed information about each thread's state, timing, and execution context.
The system maintains real-time synchronization between thread selection and memory analysis, automatically highlighting threads when their start addresses are being examined in other windows.
User Interface
Control Bar
| Component | Description |
|---|---|
| Thread Count | Displays total number of threads in the process |
| Refresh Button | Updates thread list with current process state |
| Search Bar | Text input for filtering threads by various criteria |
Threads Table
| Column | Description |
|---|---|
| Thread ID | Unique identifier for the thread within the system |
| Process ID | Process identifier that owns this thread |
| Start Address | Memory address where thread execution begins |
| State | Current execution state of the thread |
Interactive Features
- Thread Selection: Click any thread row to select and navigate to its start address
- Detailed Tooltips: Hover over threads to see additional timing and state information
- Context Menu: Right-click for copy options and bookmark creation
- Visual Feedback: Selected threads are highlighted with distinctive coloring
Advanced Features
Thread State Analysis
- Execution States: Identifies Running, Waiting, Ready, Terminated, and other thread states
- Wait Reasons: Displays why threads are waiting (Executive, FreePage, PageIn, etc.)
- Performance Metrics: Shows kernel time, user time, and context switch counts
- Creation Tracking: Displays thread creation timestamps for lifetime analysis
Memory Integration
- Address Synchronization: Automatically selects threads when viewing their start addresses
- Bookmark Support: Create memory bookmarks at thread start addresses
- Cross-Reference: Correlates thread information with memory analysis windows
- Address Validation: Ensures thread start addresses are accessible and valid
Data Export and Copy
- Individual Field Copy: Copy specific thread attributes to clipboard
- Multiple Copy Formats: Thread IDs, addresses, states, and other data
- Bookmark Creation: Add thread start addresses to bookmark collection
- Search Result Export: Copy filtered thread information
Usage Tips
- Use the refresh button to update thread information when analyzing dynamic processes
- Search by partial Thread ID or address to quickly locate specific threads
- Pay attention to thread states to identify blocked or problematic threads
- Hover over threads to see detailed timing information in tooltips
- Threads with high context switch counts may indicate performance issues
- Bookmark thread start addresses to track thread behavior over time
- Use the search function to filter threads by specific memory ranges
- Selected threads remain highlighted when switching between analysis windows
- Thread start addresses often point to interesting code locations worth examining
- Monitor thread creation times to understand process initialization patterns